
FOUNDATION
Mining Engineering, University of Tehran
A technical foundation in complex systems, quantitative work, and structured problem solving.
About
Power BI developer based in Tehran, working remotely with global clients—and expanding into Airflow, dbt, and Python dashboards to bridge BI and data engineering.
The path
The route was not linear, and that matters. Engineering built the analytical base; freelance work built the habit of shipping for real clients.
FOUNDATION
A technical foundation in complex systems, quantitative work, and structured problem solving.
THE SHIFT
Early client projects turned data analysis into practical reporting—work that had to be understood, trusted, and used.
BUILDING RANGE
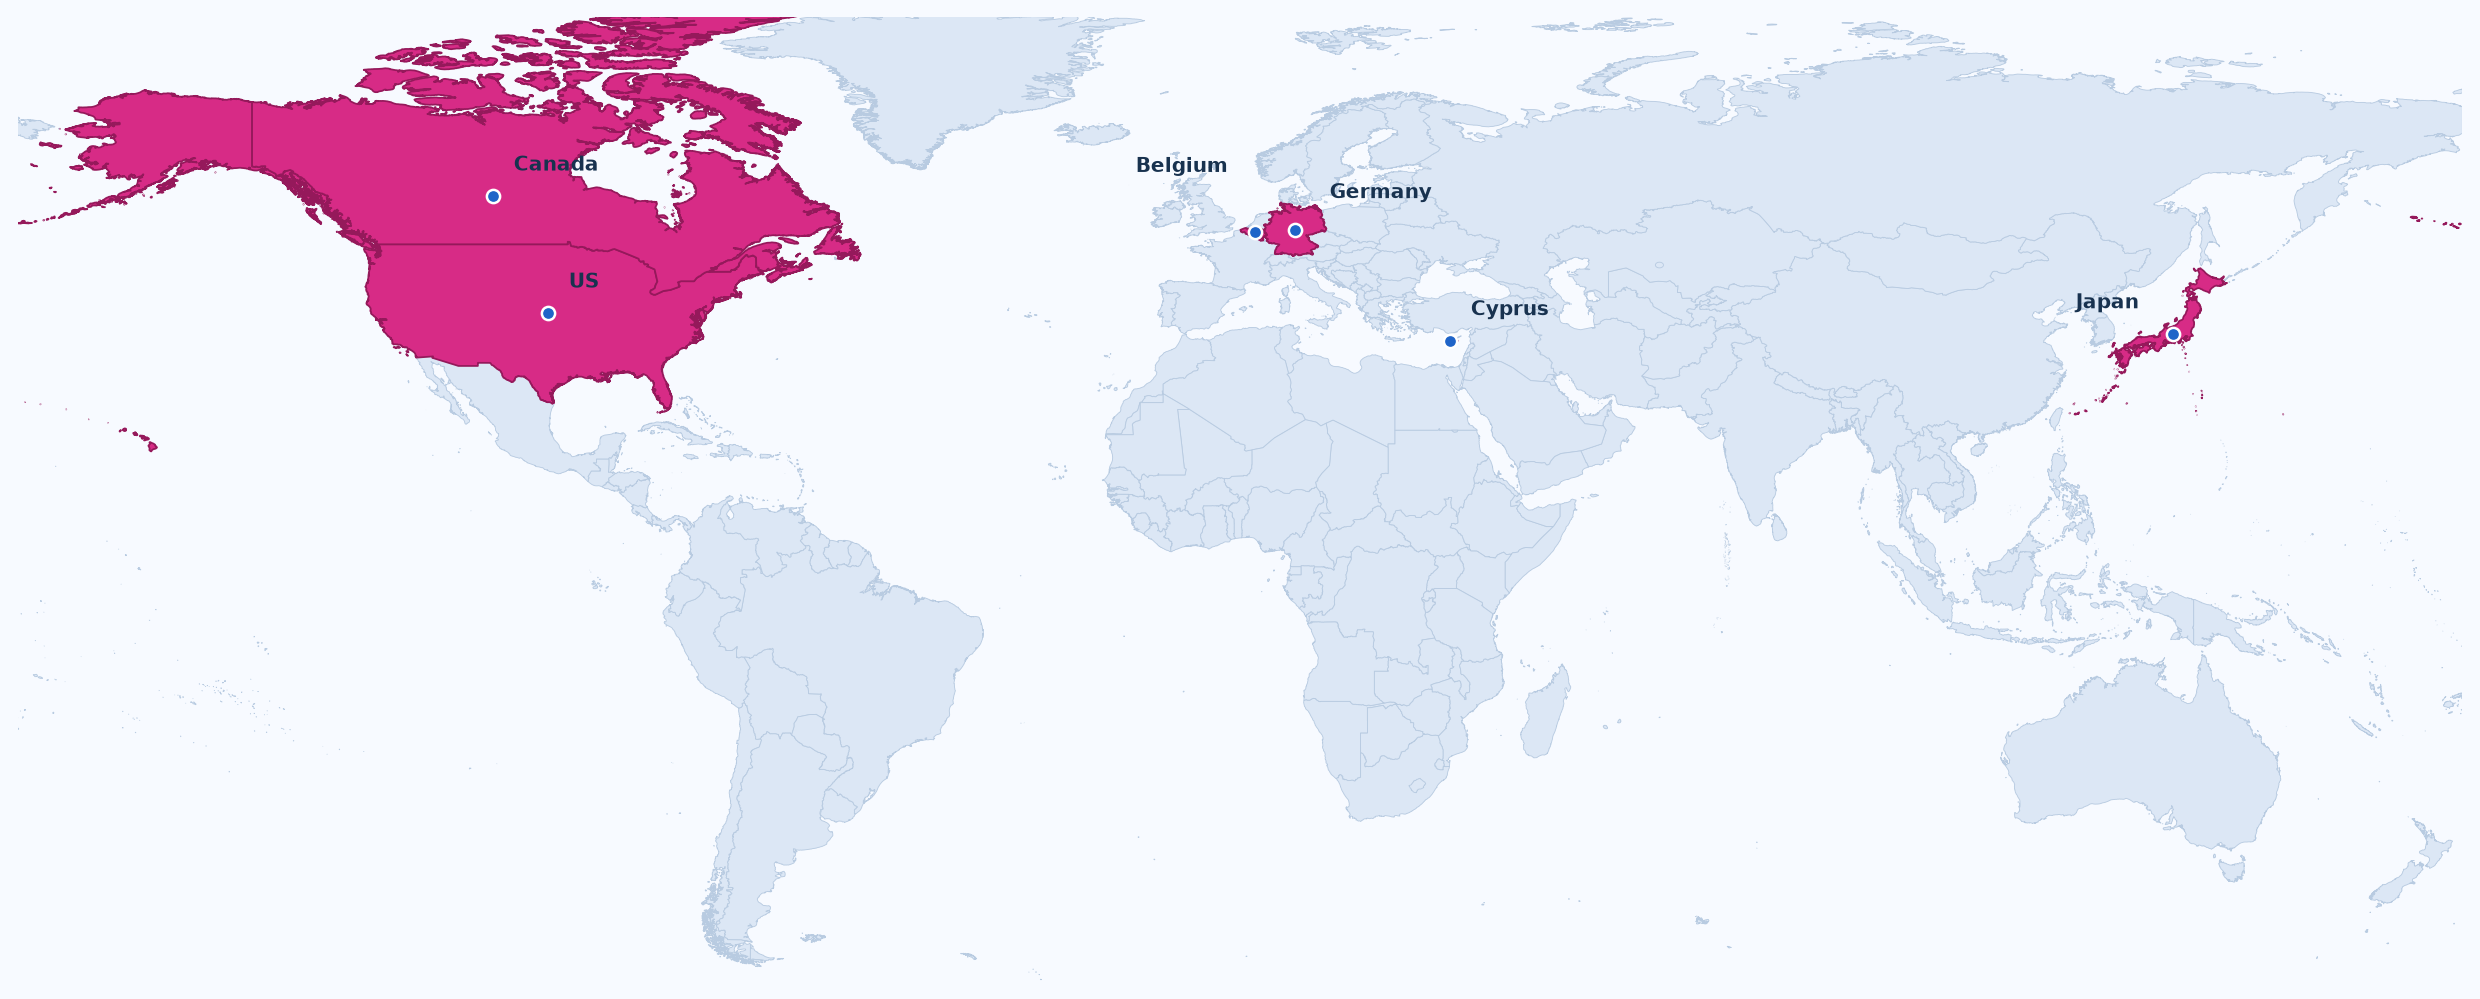
Dashboard delivery expanded into remote collaboration and global client work across retail, supply chain, finance, and tech.
TEACHING
Three months mentoring analysts—reviewing their work, sharpening their questions, and explaining the reasoning behind every technique.
TODAY
Building the Theme Generator, CF Icons tool, and reusable Power BI templates alongside independent consulting.
“I had the chance to work with Sajjad on a project, and he’s honestly one of the most professional people I’ve worked with. His strong design sense and deep DAX skills made everything easier to understand and use. He’s always easy to collaborate with, and I’d happily work with him again on any project.”
LinkedIn recommendation from a coworker
How I work
Not the visual. The decision defines everything that follows.
The interface sets the requirements the data model has to meet.
A report that answers everything answers nothing well.
Teams should be able to use and extend the work without me.
Official certificates
Books behind the craft
Ongoing study
DataCamp: marketing analytics, data governance, and the systems around responsible reporting.
Expanding into
Airflow, dbt, and Python dashboards with Plotly Dash, Streamlit, and Quarto.
Point of view
Have a reporting problem?