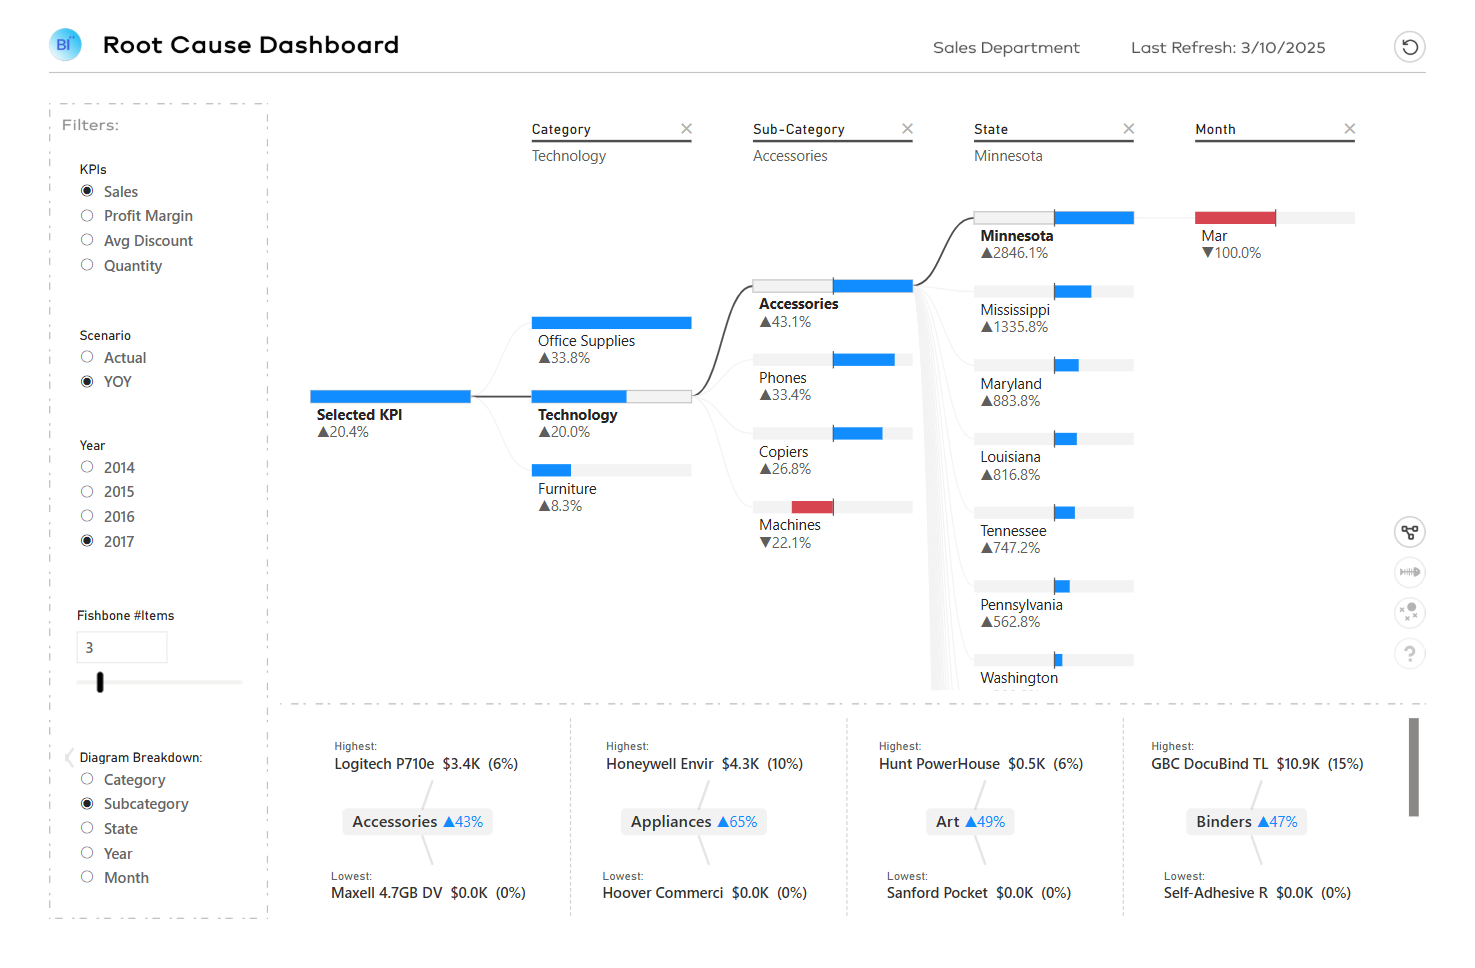
Root Cause Analysis
Four analytical views move users from a symptom to its underlying drivers.
Business Intelligence · Dashboard Design
BI developer and dashboard designer working with Power BI, Tableau, and Python for 10+ clients across retail, supply chain, finance, and tech.
Built to drive decisions
GitHub stars
Data-viz wins
LinkedIn followers
The difference
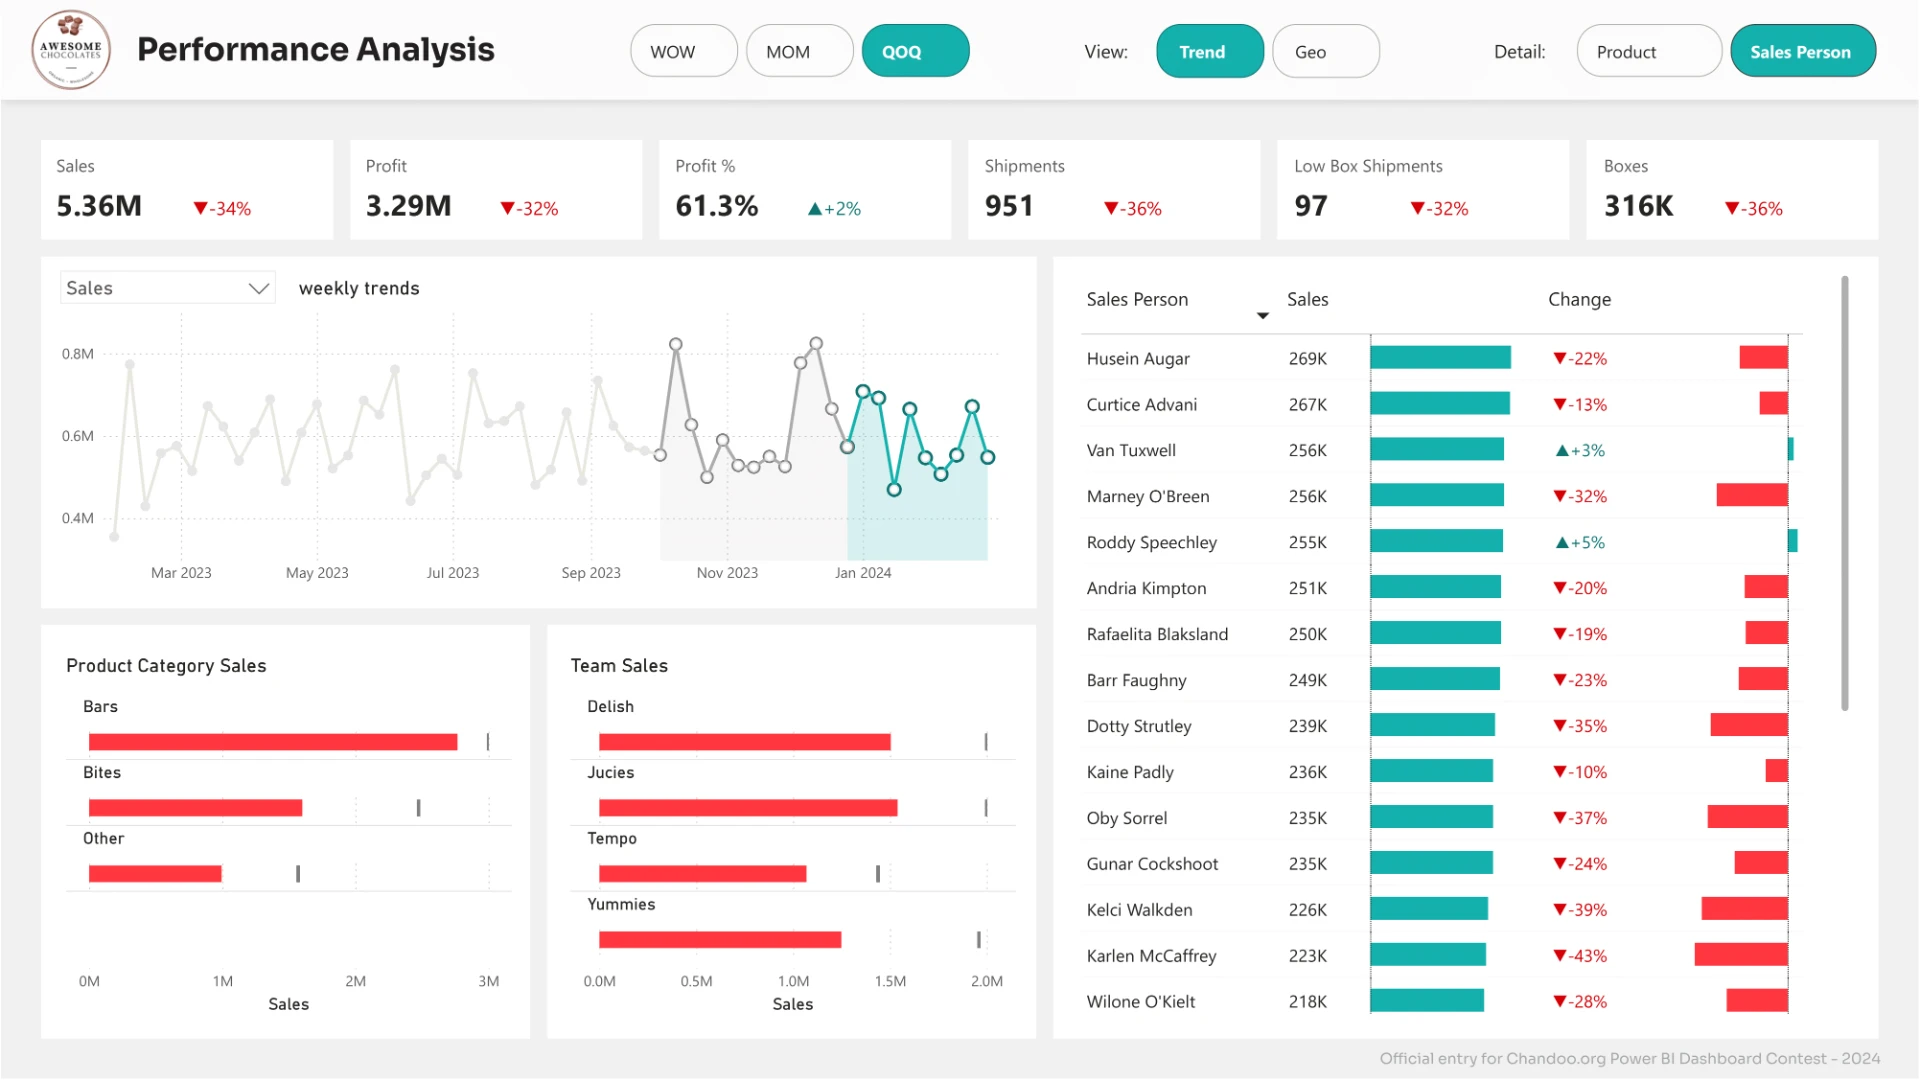
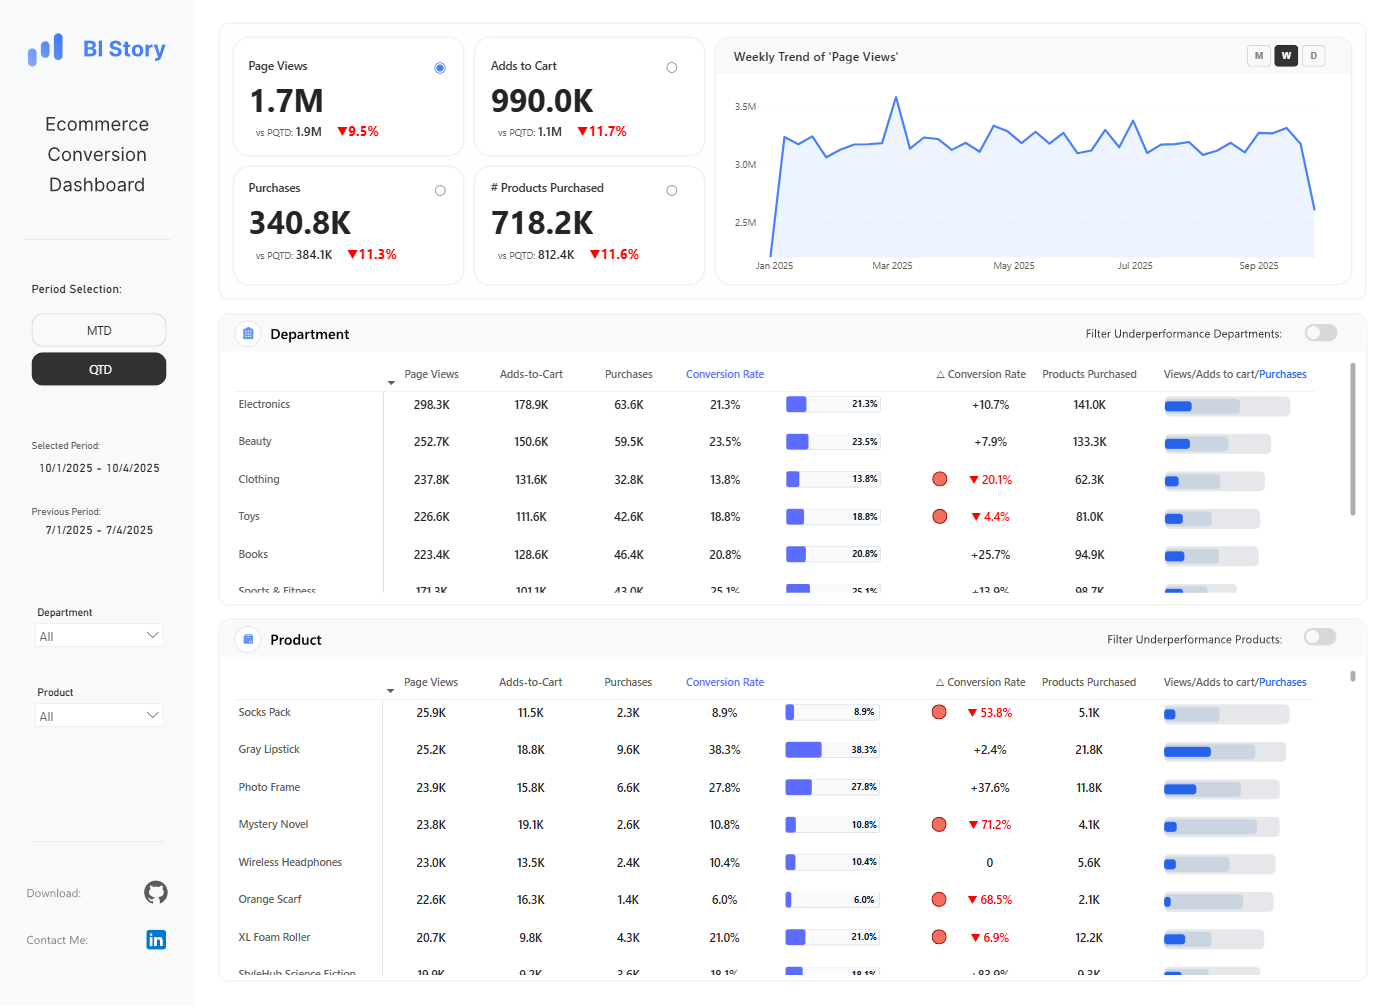
Hand-coded custom visuals and UX-first dashboard design create interfaces that fit the decision—not charts squeezed into a template.
Information hierarchy
Every level answers a different question.
Custom visual craft
SVG, HTML, CSS, and Deneb where defaults stop.
Selected work
Four analytical views move users from a symptom to its underlying drivers.
An open library used by developers worldwide, with 350+ stars.
Elasticity, segments, and targets resolved into a defensible discount.
Have a reporting problem?